By Meredith Alexander Kunz, Adobe Research
What attracts viewers’ attention the most when they look at photos, designs, or visualizations?
This question is of critical importance to digital storytellers. And it is central to the work of Zoya Bylinskii, a research scientist at Adobe Research. Bylinskii, who won an Adobe Research fellowship as a PhD student and completed an internship in the lab, joined the team full-time in 2018.
Bylinskii’s research itself has attracted attention recently: The Cambridge, Mass.-based scientist was recognized on a list of most-influential talks in AI in 2019 for her presentation at ReWork’s Deep Learning Summit Boston event, “Predicting What Drives Human Attention in Photographs, Visualizations, and Graphic Designs.”
What is important—or “salient”—in an image?
Studies of image “saliency”—pinpointing the most important, attention-grabbing elements of an image or visual—have advanced quickly, says Bylinskii. A few decades ago, scientists could model low-level elements of perception, such as how a brightly colored element against a plain background can pop out and direct attention.
Increasingly, saliency modeling has moved on to more complex, higher-level tasks requiring models to be able to predict things like “where are the faces?” and “where are the faces looking?”
Bylinskii points out that the human brain naturally turns an image into a story, so if people see a ball is moving, their eyes are likely to follow along to where they think it’s heading. The same thing happens when we see a person gazing at something. We, too, want to see what he or she is looking at.
“This makes modeling human-level attention challenging, since having a computer-based model look at an image just like a human requires a lot of visual reasoning,” Bylinskii explains.
Until recently, Bylinskii evaluated pretty much every new saliency model developed by scientists by running the MIT Saliency Benchmark, a key dataset in the field. She has since passed this benchmark on to a colleague.
Figuring out what attracts visual attention
For years, researchers have sought to gather information about where people’s eyes look through eye tracking studies. This approach uses a physical setup and camera that records where a person’s eyes gaze, and it can accurately measure visual attention by tracking how long the subject gazes at different regions of an image.
However, there’s a big problem with eye tracking, says Bylinskii: “Gathering eye movement data is hard to scale.” Setting up the equipment in a lab makes this kind of study pricey, time-limited, and location-bound.

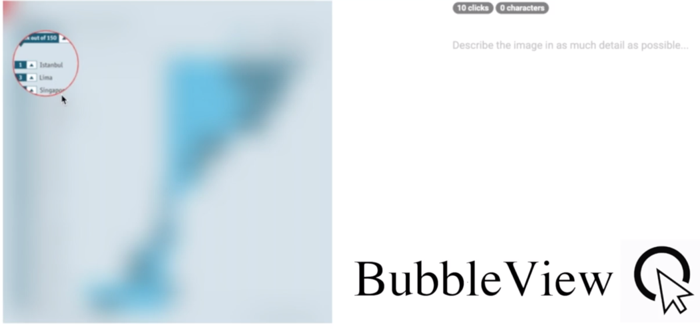
So Bylinskii, along with MIT and Harvard collaborators, has designed a toolbox of methods to make gathering where people look a lot easier, faster, and less expensive. One method, BubbleView, offers viewers blurred images and a mouse to click on them. Each time a person clicks an area she or he would like to see better, a small, circular spot is clearly revealed at original resolution. Another approach, called ZoomMaps, converts pinch-zoom gestures on a smartphone into an approximate attention map.
The research group’s full paper has been accepted to CHI 2020 (the ACM CHI Conference on Human Factors in Computing Systems) and will be presented in April. On the team’s website, you can try out live demos of these methods.
Making predictions about designs and visualizations
Armed with this kind of information, Bylinskii and others are now studying in more detail what people look at—and what they remember later.
Bylinskii has a special interest in non-natural imagery, including graphic designs and data visualizations, and how to make information memorable. While a graduate student at MIT, she showed that people remember a visualization best when it includes a visual element that reinforce the idea. For example: A bar graph that has country flags on the axis, rather than only country names, was far more memorable to viewers.
“If you want to design for mass public perception at a glance, you need to go for visual forms,” Bylinskii says.
Bylinskii’s work during her Adobe Research internship used AI to model what people pay attention to in designs and visualizations. She collaborated with Adobe Research’s Aaron Hertzmann and Bryan Russell and others to develop a neural-network-based method to predict where people would look in graphic designs, such as a magazine cover or poster, and in data visualizations.

The technique can track predictions as the designer moves elements around the piece. The team’s tools created heat maps to show the most noticeable areas of text and imagery. Their research paper, “Learning Visual Importance for Graphic Designs and Data Visualizations,” earned an honorable mention award at ACM UIST 2017 (the ACM Symposium on User Interface Software and Technology).
“Our model learns from designs for which we collected attention data. It learns color, location, crowding. Then it can give predictions for where people are likely to look in a design,” says Bylinskii.
The work relied in part on crowdsourced BubbleView click data, which was used to train the model. Bylinskii is currently working on an improved model that generalizes to a wide variety of different graphic design types (websites, posters, mobile UIs, and more).
Time, memory, and context
Bylinskii is exploring time and memory further in current projects. “How long a person has to view imagery has an impact on what she or he recalls later,” she says. That’s important to know if you are creating a poster for a bus that drives around town, versus designing a visual display inside a museum, for example. This work was presented this past December at a NeurIPS conference workshop.
In her new work, Bylinskii explains that she is “taking more of the user’s viewing context into account when modeling attention.” It’s another valuable pathway to understanding and predicting how people see the imagery all around them.